Upcoming Events:
| VCF West | Aug 01 - 02 2025, | CHM, Mountain View, CA |
| VCF Midwest | Sep 13 - 14 2025, | Schaumburg, IL |
| VCF Montreal | Jan 24 - 25, 2026, | RMC Saint Jean, Montreal, Canada |
| VCF SoCal | Feb 14 - 15, 2026, | Hotel Fera, Orange CA |
| VCF Southwest | June, 2025 | University of Texas at Dallas |
| VCF Southeast | June, 2025 | Atlanta, GA |
-
Please review our updated Terms and Rules here
You are using an out of date browser. It may not display this or other websites correctly.
You should upgrade or use an alternative browser.
You should upgrade or use an alternative browser.
New to Apple II & Troubleshooting
- Thread starter ethump
- Start date
Gary C
Veteran Member
I bet its behaviour is random, its probably stuck in a loop there.
Put channel 2 on to the reset, and set the trigger to channel 2 and single then select the icon that shows a rising pulse. It will than draw a trace from both channels and stop.
Its going to take time to find the fault with just a scope, but I bet its still RAM which one of those little RAM testers would really help with.
Interesting turn of events. Yes, mine, like yours, is measuring 3.5 volts which surprises me as I would expect it to be 5 volts. I'll have to research this but I am going to conclude, at least for now, this is not causing the failure.Volts/div is per the screen - 1V/div? Shows 3.5V peaks the same as yours?
Just had a quick look at pin7 again, and it's showing a standing square wave, no flatline now(yes, I know this one is 2v/div now)
View attachment 1238549
ethump
Experienced Member
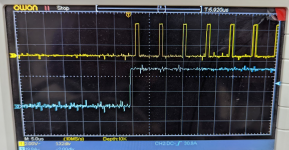
Okay - fiddled with this triggering thing... fun!
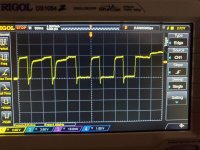
The settings for Ch2 were AC and other stuff so sorted that out and it looks like what I think we're looking for..
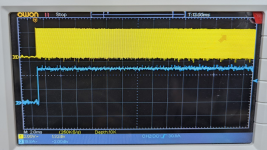
and zoomed in a bit:
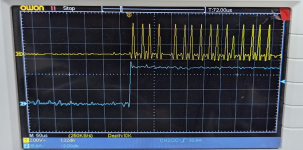
As an aside: https://www.ebay.com/itm/372247259576 ... If it looks too good to be true... it usually is, right?
The settings for Ch2 were AC and other stuff so sorted that out and it looks like what I think we're looking for..

and zoomed in a bit:

As an aside: https://www.ebay.com/itm/372247259576 ... If it looks too good to be true... it usually is, right?
ethump
Experienced Member
That's what you want to see. If this is consistent my recommendation would be to turn back to the DRAM chips and ensure there is activity on all of the outputs. You noted in post 69 that some of the chips didn't show activity. This is suspicious to me as all eight should show activity (especially since they're used in parallel).
As for the DRAM chips in the Ebay you linked to <$8.00 for five is reasonable. My only concern is they come from China and therefore the quality is always suspect (to me). Adrian did a channel on some chips he purchased from China and they ended up being problematic. Still less than $8.00 seems low risk.
EDIT: Your trace looks unusual in that the signal is consistent (symmetrical peaks and valleys). Here is what mine looks like (with a longer view than the first one). You do not not see a consistent repeating pattern in this trace:
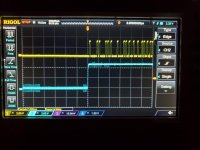 :
:
As for the DRAM chips in the Ebay you linked to <$8.00 for five is reasonable. My only concern is they come from China and therefore the quality is always suspect (to me). Adrian did a channel on some chips he purchased from China and they ended up being problematic. Still less than $8.00 seems low risk.
EDIT: Your trace looks unusual in that the signal is consistent (symmetrical peaks and valleys). Here is what mine looks like (with a longer view than the first one). You do not not see a consistent repeating pattern in this trace:
 :
:
Last edited:
ethump
Experienced Member
Yes, regarding the uniformity of my trace as compared yours, I thought that too.
Small update. Using a BBC, I tested the Apple's speaker (it works) and did a switcheroo on the 6502 CPU. The Apple's works fine in the BBC. The Apple displays the same symptoms with the Beeb's CPU installed.
I'll track down a RAM tester!
Small update. Using a BBC, I tested the Apple's speaker (it works) and did a switcheroo on the 6502 CPU. The Apple's works fine in the BBC. The Apple displays the same symptoms with the Beeb's CPU installed.
I'll track down a RAM tester!
In the interim I would recommend checking pins two and fourteen on the first row of DRAM chips. You mentioned in an earlier post some of the outputs on a few of the DRAM chips did not look right. That would suggest a bad chip. If possible can you recheck and post a pic of something you feel looks right and one that you think is not right?Yes, regarding the uniformity of my trace as compared yours, I thought that too.
Small update. Using a BBC, I tested the Apple's speaker (it works) and did a switcheroo on the 6502 CPU. The Apple's works fine in the BBC. The Apple displays the same symptoms with the Beeb's CPU installed.
I'll track down a RAM tester!
daver2
10k Member
Uniformity of the CPU SYNC signal implies that the CPU is either (a) executing the same instruction over and over again or (b) the same instruction sequence - with each instruction taking the same amount of time - over and over again.
With your 'new found' oscilloscope knowledge (nothing like learning on the job - but you are learning...) does the CPU still go into the weeds after a period of time and you stop getting SYNC pulses or not now?
If the CPU goes into the weeds, you can use this fact (triggering on the leading edge of the SYNC pulse) to capture the address and data bus contents when it does go into the weeds. It still may not tell us much though - but may identify if a KIL instruction is to blame and (more importantly) whether this instruction was in ROM (or not) and (if so) whether the byte value in the ROM is correct or corrupt.
You would do this by using the other channel of your oscilloscope to probe the address and data lines one bit at a time when the CPU goes into the weeds. You will then know what the address and data bus were are the time of the last instruction that was ever executed.
Dave
ethump
Experienced Member
oldpcguy - If you check the Google Photo's album I shared earlier, there should be a video in it of me tracing those pins. This link might work also.
Dave - okay thanks. That's some heavy stuff there but will give it a go maybe later. You're saying to set a trigger on the SYNC and capture each of the 16 address lines and 8 data lines in turn. Idea being that we overlay each sample to create a picture of whats going on with the processor?
Dave - okay thanks. That's some heavy stuff there but will give it a go maybe later. You're saying to set a trigger on the SYNC and capture each of the 16 address lines and 8 data lines in turn. Idea being that we overlay each sample to create a picture of whats going on with the processor?
I'll check it out.oldpcguy - If you check the Google Photo's album I shared earlier, there should be a video in it of me tracing those pins. This link might work also.
Dave - okay thanks. That's some heavy stuff there but will give it a go maybe later. You're saying to set a trigger on the SYNC and capture each of the 16 address lines and 8 data lines in turn. Idea being that we overlay each sample to create a picture of whats going on with the processor?
EDIT: To confirm what I am seeing, you're first checking pin 14 on the eight DRAM chips and then pin 2?
As for Daves suggestion I think his recommendation is to perform the check only if the sync activity stops at some point. Given that initially there was no activity on this pin and then suddenly there was it may suggest an intermittent problem. I would recommend that you connect the scope up to the sync pin and let it run for 30 minutes to see if it stops. If after this time interval it doesn't then I think it's safe to assume, at least for the time being, the problem has mysteriously self-corrected (or wasn't a problem to begin with and maybe your inexperience with the scope was the culprit).
Last edited:
ethump
Experienced Member
So the presence of that SYNC is not consistent. Sometimes when I turn the machine on, SYNC will pulse for a short period (literally 3 or 4 pulses) then flatline. Sometimes 70, 80, 90 or so pulses, then flatline, but most often (probably 70% of the time) it'll stay pulsing until I turn it off.
The screen now seems to be consistently (between restarts) flashing black and white vertical bars now.
RAM activity seems the same regardless of whether there's a SYNC pulse or not.
I get RAM activity even in the empty sockets. Like Dout shows activity even though there's no chip in there. Further investigation shows the 3x Dout's in each column seem to show the same chatter (1 chip in, 2 vacant slots). Is that normal? Really need to read those books!
EDIT: OldPCGuy - yes, I went along Pin14 first then came back along Pin2
daver2
10k Member
Ignore what I said if the SYNC pulse observation is random.
You need a similar diagnostic ROM on the Apple that I developed for the Commodore PET (PETTESTE2K) - unless there is one already...
Dave
You need a similar diagnostic ROM on the Apple that I developed for the Commodore PET (PETTESTE2K) - unless there is one already...
Dave
The sync pin goes high when the processor is fetching an opcode from memory and low when it is not. How it behaves depends on the instructions being executed.So the presence of that SYNC is not consistent. Sometimes when I turn the machine on, SYNC will pulse for a short period (literally 3 or 4 pulses) then flatline. Sometimes 70, 80, 90 or so pulses, then flatline, but most often (probably 70% of the time) it'll stay pulsing until I turn it off.
The screen now seems to be consistently (between restarts) flashing black and white vertical bars now.
RAM activity seems the same regardless of whether there's a SYNC pulse or not.
I get RAM activity even in the empty sockets. Like Dout shows activity even though there's no chip in there. Further investigation shows the 3x Dout's in each column seem to show the same chatter (1 chip in, 2 vacant slots). Is that normal? Really need to read those books!
EDIT: OldPCGuy - yes, I went along Pin14 first then came back along Pin2
Bad memory, either the ROMs or DRAMs, would cause the sporadic behavior. Since the ROMs are mask ROMs it's unlikely their contents would change between power cycles. The DRAMs would be different and likely power up with a different state each time.
I don't have the schematics in front of me right now but I would expect activity on both sides as I believe they're shared busses.
The input pin traces on the first three chips looks odd (they all do but these three stand out). The first and third chips look too well defined (like a square wave generator) and the second while not well defined like one and three it has a pattern which doesn't vary.
Are you performing your testing with the other two rows of DRAM chips installed? I would recommend removing them to ensure they're not interfering with your measurements.
Other chips which may be at issue: All of the ROMs (D0, D8, E0, E8, F0, and F8), a couple of multiplexers: B6 (lower four bits) and B7 (upper four bits), and the processor bus transceivers: H10 (upper four bits) and H11 (lower four bits)
If I were troubleshooting this the first thing I would do is to:
- Remove all DRAM chips in the second and third row and leave them out for all further testing.
- Remove all the ROMs except F8, check output pins (D0 - D7: pins 9, 10, 11, 13, 14, 15, 16, and 17 respectively), install F0 and repeat testing. Repeat installing the next and measuring until all ROMs are reinstalled.
- Remove B6 and recheck the input pins on D0 - D3 (first four chips from the left)
- Replace B6 and pull H11, measure signals. Since the 6502 talks to the data bus through H10 and H11 I am not sure what to expect.

Last edited:
Drken
Experienced Member
"I've opened it up and cleaned it and given the PSU a full recap."
What was the behavior before you did a full recap?
What was the behavior before you did a full recap?
ethump
Experienced Member
"I've opened it up and cleaned it and given the PSU a full recap."
What was the behavior before you did a full recap?
Didn't test it. Opened it all up and saw some caps were bulging so just replaced the lot.
ethump
Experienced Member
Right.... update....
DRAM tester purchased and deployed against all 24 chips. A total of 6 tested bad, the rest yielded 4x blue LEDs so all good.
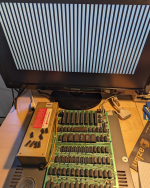
With a bank of 8 known good chips on the first row, I still see the flashing vertical bars per below. This seems to be the pattern it's settled on for the past couple of weeks. The random characters are gone. The only thing I can think of that changed this behavior is that a couple of weeks back I accidentally stumbled on a working set of 8x RAM chips which has revealed this new symptom.
So I guess the testing/swapping the ROMs is the next step? Any pointers?

You cannot swap ROMs between the different locations as they contain different code. It shouldn't hurt anything to swap them but the system won't start up. Or are you referring to swapping ROMs with another system?Right.... update....
DRAM tester purchased and deployed against all 24 chips. A total of 6 tested bad, the rest yielded 4x blue LEDs so all good.
With a bank of 8 known good chips on the first row, I still see the flashing vertical bars per below. This seems to be the pattern it's settled on for the past couple of weeks. The random characters are gone. The only thing I can think of that changed this behavior is that a couple of weeks back I accidentally stumbled on a working set of 8x RAM chips which has revealed this new symptom.
So I guess the testing/swapping the ROMs is the next step? Any pointers?
I'll have to give some thought as to how to proceed. Are you operating the system with two rows of good DRAMs and none in the third?
ethump
Experienced Member
Yes, I know each ROM has it's designated socket. I was thinking about finding some from another system perhaps, or burning some new ones. I'd be very surprised if the ROM images aren't available but I've no idea if the appropriate blank EPROMS can be sought.
Per the picture, you can see I have populated one row of known-good DRAM chips. I have tried populating the 2nd row also but it yields the same result.
cheers
Per the picture, you can see I have populated one row of known-good DRAM chips. I have tried populating the 2nd row also but it yields the same result.
cheers

